Packet Power Launches New Compact Wireless Multi-Circuit Monitors
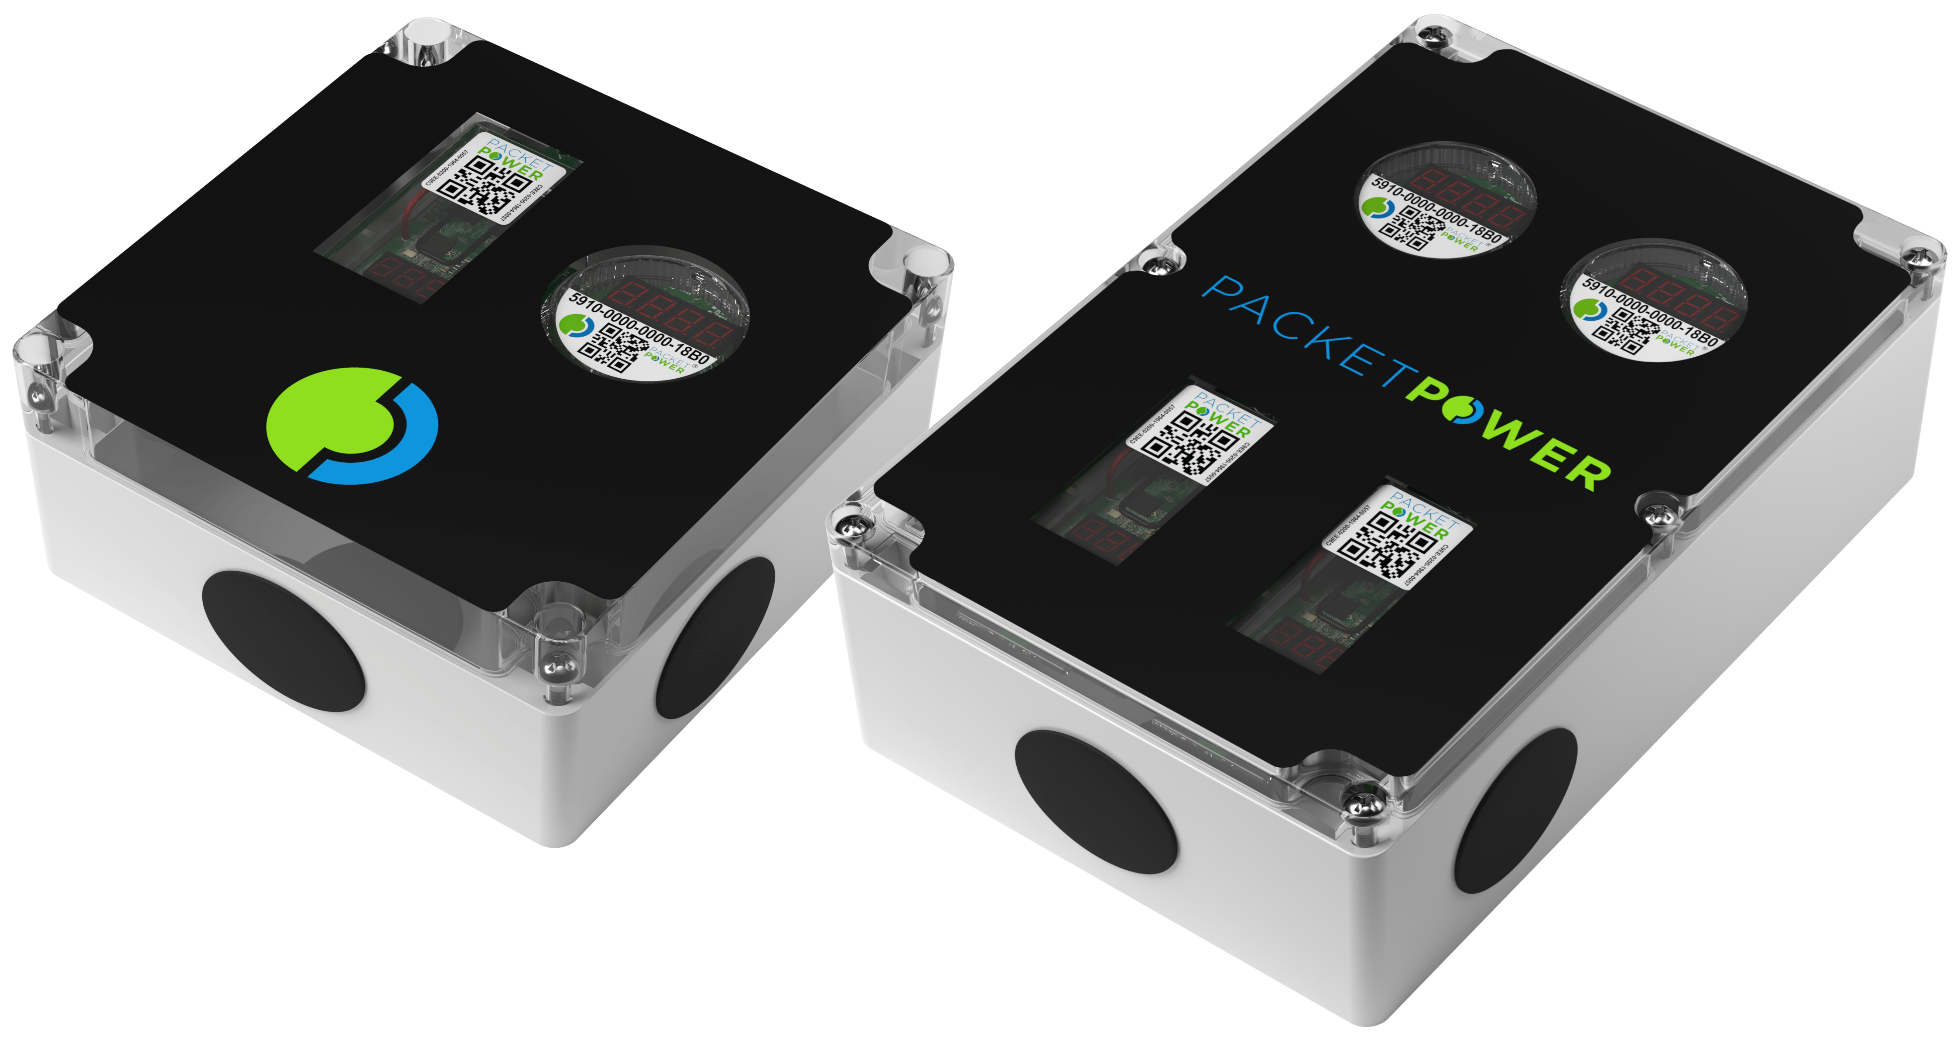
The new monitors offer an easy way to add monitoring to some or all of the circuits on switchgear, panelboards, HVAC units, generators and other...
3 min read
![]() Packet Power Team
:
Jul 27, 2016 9:30:00 AM
Packet Power Team
:
Jul 27, 2016 9:30:00 AM

Packet Power uses the local LED display on our newer meters to show more than just amps by phase. That's good, but it can get a little cryptic. Is "con" a good thing? If so, why don't you see it all the time? What does "no" mean? Why does Packet Power use a "U" to communicate voltage? And what's up with the red and green blinking lights?
Read on for a quick overview of all that your power meter is telling you.
OVERALL
DEVICE FIRST POWERED ON
There is an initial series of displays when you power on your device. Unless you have connectivity issues, you will only see these values one time.
| Order of display |
Label |
Value (example) | What the label and value mean |
| First | 8.8.8.8 | Simply confirms that all segments of the display are working | |
| Second | P5 | 34 | This is the version of firmware your device is using |
| Third | Id | 321 | Shows the last three characters of the device serial number |
| Fourth | rF | EC.1 | Shows configured radio zone |
| Fifth | con | EC.1 | Indicates the node has successfully joined the mesh network in the specified radio zone. This is displayed once after successful connection and does not appear again as long as the node is connected |
| Fifth (alternative) | no | EC.1 | This displays when the node has NOT successfully joined the mesh network. A flashing "no" indicates the node is attempting to connect. It will change to "con" when connection is established. This will display immediately on loss of connectivity and repeat in the LED display cycle until connected. |
ONGOING DISPLAYS
Single-phase circuit
If you have a single-phase meter, your LED will continuously cycle through the following displays.
| Order of display | Label | Value (example) | What the label and value mean |
| First | A | 12.4 | "A" indicates amperage and the numbers following are the real-time amperage reading |
| Second | U | 121 | "U" indicates voltage and the numbers following are the real-time voltage reading |
You will see "A" for slightly less than one second , then the actual amperage for slightly more than one second. Then you'll see "U" for slightly less than one second and then the actual voltage for slightly more than one second. And, unless you've lost connectivity, the cycle will repeat.
Three node / Three-phase circuit
If your power meter is measuring a three-phase circuit, your LED will continuously cycle through the following displays.
| Order of display | Label | Value (example) | What the label and value mean |
| First | A1 | 12.4 | "A1" indicates amperage for the first node and the numbers following are the real-time amperage reading |
| Second | U1 | 121 | "U1" indicates voltage for the first node and the numbers following are the real-time voltage reading |
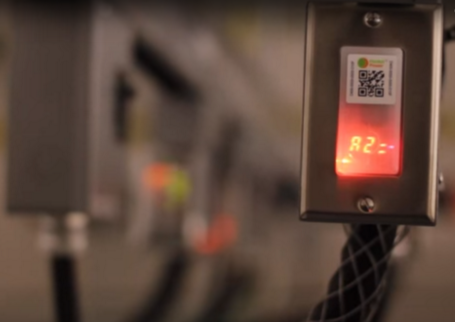
| Third | A2 | 12.3 | "A2" indicates amperage for the second node and the numbers following are the real-time amperage reading |
| Fourth | U2 | 120 | "U2" indicates voltage for the second node and the numbers following are the real-time voltage reading |
| Fifth | A3 | 12.2 | "A3" indicates amperage for the third node and the numbers following are the real-time amperage reading |
| Sixth | U3 | 121 | "U3" indicates voltage for the third node and the numbers following are the real-time voltage reading |
You will see "A1" for slightly less than one second , then the first node's actual amperage for slightly more than one second. Then you'll see "U1" for slightly less than one second and then the first node's actual voltage for slightly more than one second. Then "A2" followed by the second node's amperage reading, then "U2" followed by the second node's voltage reading, etc.
LOSE CONNECTIVITY
If your monitoring unit loses wireless connectivity, a "no" and the applicable radio zone will appear at the beginning of the cycle. Note that you will continue to see amperage and voltage readings for the affected node. When connectivity is reestablished, you'll see "con" and the reconnected radio zone for one cycle after which you will just see the amperage and voltage readings.
WHAT ABOUT THOSE BLINKING RED AND GREEN LIGHTS?
Wondering what the red and green blinking lights mean? Get the details on our Smart Power Cable Indicator Lights and LED Display support page.
Packet Power is committed to ensuring an excellent customer experience. We have a wealth of customer and partner resources accessible from our Support page. You may also email support@packetpower.com for assistance.

The new monitors offer an easy way to add monitoring to some or all of the circuits on switchgear, panelboards, HVAC units, generators and other...

There are countless reasons for monitoring power in data centers. We've outlined some of the most common applications and the resulting benefits....
.png)
If long lead times on intelligent rack PDUs are putting your deployment schedule at risk, Packet Power can help. Our Smart Power Cables are the...